A visual guide to Stata graphicsMichael N. Mitchell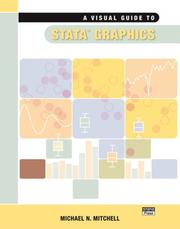
A visual guide to Stata graphics
Michael N. Mitchell · 2012
איפה לקנות
בדקו את המחיר העדכני באמזון. אנחנו לא מציגים מחירים כי הם משתנים מדי יום.
לצפייה באמזוןקישור שותפים. בתור שותפים של Amazon אנחנו מרוויחים מרכישות מתאימות.
על הספר
With over 900 illustrated examples and quick-reference tabs, this guide shows you how to create and customize graphs for any type of statistical data using either Stata commands or the Graph Editor. The author displays each graph example in full color with simple and clear instructions.
פרטי הספר
- שנה
- 2012
- שפה
- English
- הוצאה
- Stata Press
- מהדורות
- 8
- עמודים
- 499
- ISBN
- 9781597181068
מקור הנתונים: Wikidata
עוד של Michael N. Mitchell
Interpreting And Visualizing Regression Models Using StataMichael N. Mitchell
Interpreting And Visualizing Regression Models Using Stata
Michael N. Mitchell · 2021
Stata for the Behavioral SciencesMichael N. Mitchell
Stata for the Behavioral Sciences
Michael N. Mitchell · 2015
Data management using StataMichael N. Mitchell
Data management using Stata
Michael N. Mitchell · 2010