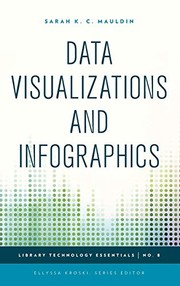
Data Visualizations and Infographics
Sarah K. C. Mauldin · 2015
איפה לקנות
בדקו את המחיר העדכני באמזון. אנחנו לא מציגים מחירים כי הם משתנים מדי יום.
לצפייה באמזוןקישור שותפים. בתור שותפים של Amazon אנחנו מרוויחים מרכישות מתאימות.
על הספר
"This how-to guidebook provides you with the tools and inspiration you need to use infographics and data visualization techniques in your library to knock your audience{u2019}s socks off as you tell your story in a visual format that can be consumed and understood at a glance. You will learn how to: use the tools you already have to create a simple infographic; create a library services infographic using Piktochart; create instructional infographics with Easel.ly; create interactive timelines; mindmap your brainstorming meetings; create library flowcharts and diagrams using Creately; create interactive maps with imported data; and create complex data visualizations."--Provided by publisher.
פרטי הספר
- שנה
- 2015
- שפה
- English
- הוצאה
- Rowman & Littlefield Publishers
- מהדורות
- 2
- עמודים
- 134
- ISBN
- 9781442243866
מקור הנתונים: Wikidata