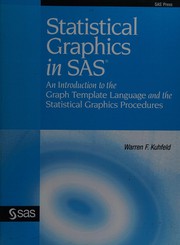
Statistical graphics in SAS
Warren F. Kuhfeld · 2010
איפה לקנות
בדקו את המחיר העדכני באמזון. אנחנו לא מציגים מחירים כי הם משתנים מדי יום.
לצפייה באמזוןקישור שותפים. בתור שותפים של Amazon אנחנו מרוויחים מרכישות מתאימות.
על הספר
"The Graph Template Language (GTL) and the Statistical Graphics (SG) procedures are powerful new additions to SAS for creating high-quality statistical graphics. Warren F. Kuhfeld's Statistical Graphics in SAS: An Introduction to the Graph Template Language and the Statistical Graphics Procedures provides a parallel and example-driven introduction to the SG procedures and the GTL. Most graphs in the book are produced in at least two ways. Each example provides prototype code for getting started with the GTL and with the SG procedures. While you do not need to write a template to make many useful graphs, understanding the GTL enables you to create custom graphs that cannot be produced by the SG procedures. Knowing the GTL also helps you modify the sometimes complex templates that SAS provides"--Resource description page.
פרטי הספר
- שנה
- 2010
- שפה
- English
- הוצאה
- SAS Institute
- מהדורות
- 1
- עמודים
- 211
- ISBN
- 9781607644866
מקור הנתונים: Wikidata