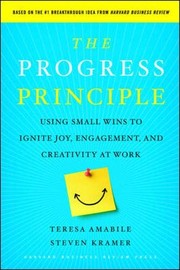
Against all odds--inside statistics
Teresa Amabile · 2011
Where to buy
Check today’s price on Amazon. We do not show prices because they change daily.
View on AmazonAffiliate link. As an Amazon Associate we earn from qualifying purchases.
About the book
With program 9, students will learn to derive and interpret the correlation coefficient using the relationship between a baseball player's salary and his home run statistics. Then they will discover how to use the square of the correlation coefficient to measure the strength and direction of a relationship between two variables. A study comparing identical twins raised together and apart illustrates the concept of correlation. Program 10 reviews the presentation of data analysis through an examination of computer graphics for statistical analysis at Bell Communications Research. Students will see how the computer can graph multivariate data and its various ways of presenting it. The program concludes with an example . Program 11 defines the concepts of common response and confounding, explains the use of two-way tables of percents to calculate marginal distribution, uses a segmented bar to show how to visually compare sets of conditional distributions, and presents a case of Simpson's Paradox. Causation is only one of many possible explanations for an observed association. The relationship between smoking and lung cancer provides a clear example. Program 12 distinguishes between observational studies and experiments and reviews basic principles of design including comparison, randomization, and replication. Statistics can be used to evaluate anecdotal evidence. Case material from the Physician's Health Study on heart disease demonstrates the advantages of a double-blind experiment.
Book details
- Year
- 2011
- Language
- English
- Series
- PED 665 (NU course)
- Publisher
- Annenberg Media
- Editions
- 1
- Pages
- 120
- ISBN
- 9781576808207
Data source: Wikidata