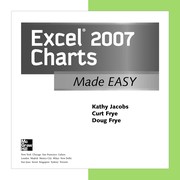
Excel 2007 charts made easy
Kathy Jacobs · 2009
Where to buy
Amazon’s price changes daily, so the most accurate place to see it is there, at the moment you buy.
View on AmazonThis is an affiliate link: if you buy through it, the site earns a small commission at no extra cost to you, which helps us bring quality content and maintain the site. As an Amazon Associate we earn from qualifying purchases.
About the book
Get beyond the basics with Excel 2007 chartsNow you can take your Excel charting skills to the next level with help from this hands-on guide. Excel 2007 Charts Made Easy shows you how to upgrade from simple pie and bar charts to rich data visualization using the full range of charts available in the latest version of the software. Discover how easy it is to create custom charts with compelling effects and to display data in more meaningful ways.Manually format chart componentsShow trends in your data with line chartsCombine line and pie charts to create area chartsPlot data using scatter charts and bubble chartsCreate and format stock chartsConnect three data points with a surface chartDisplay the relationship between various data series using doughnut chartsCompare data values with radar chartsUse PivotTables and PivotCharts to work with dynamic dataIncorporate Excel charts into Word documents and PowerPoint presentations
Book details
- Year
- 2009
- Language
- English
- Publisher
- McGraw-Hill
- Editions
- 2
- ISBN
- 9780071600071
Data source: Wikidata